Node Red Flows
Raspberry Pi - 4 Sensors With Logging and Charts
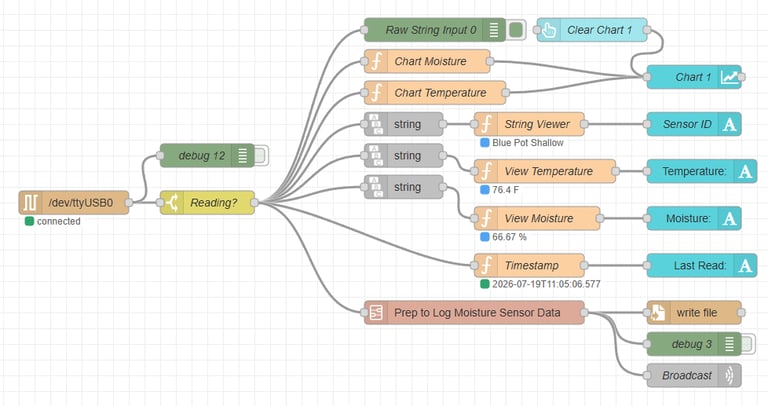
This flow handles 4 sensors and loggs data to a file of the same name as the sensor ID. If you change the sensor ID, a new file will be created.
Features
Sensor Commands
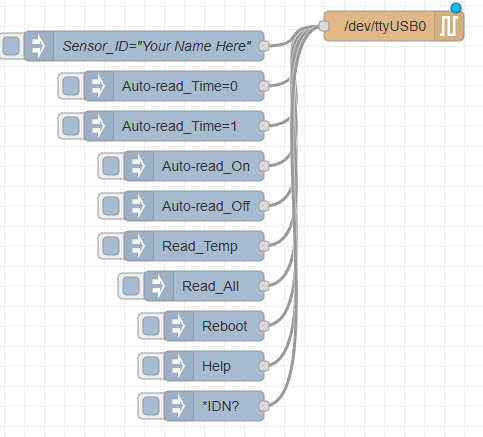
A set of inject nodes are ready to send commands to the sensor over the serial port.
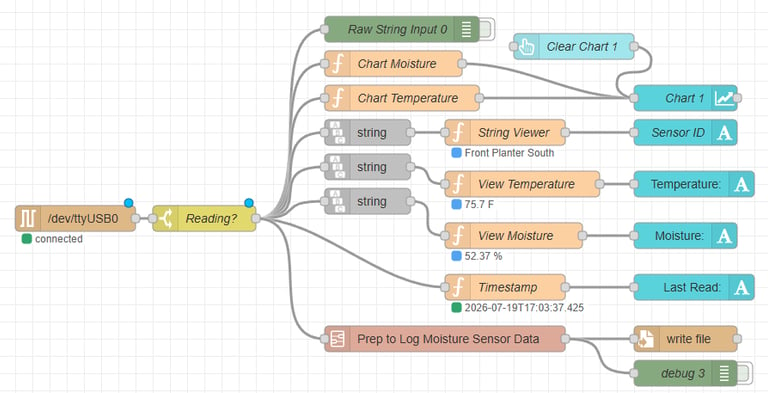
Sensor Output String Parse
The incoming string from the sensor is parsed for each data value. handy function nodes are used to display this data within the flow.
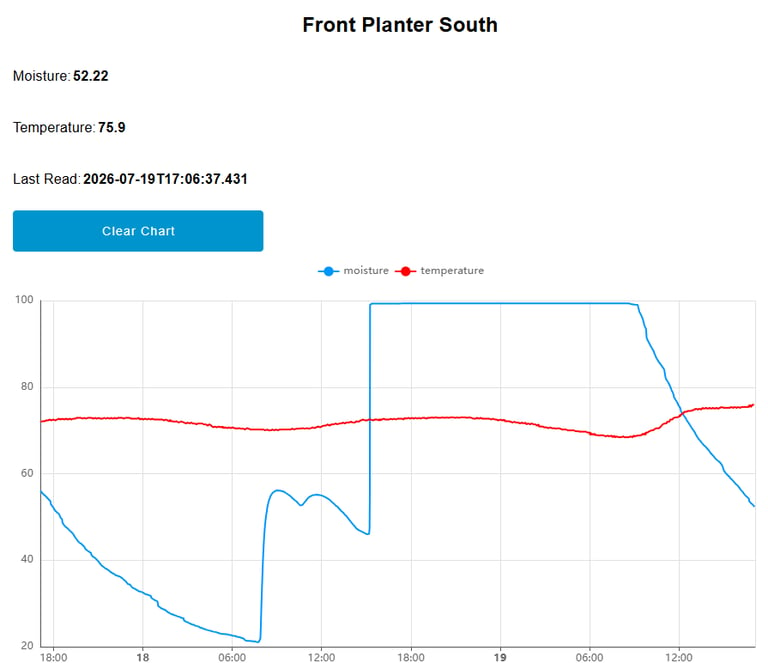
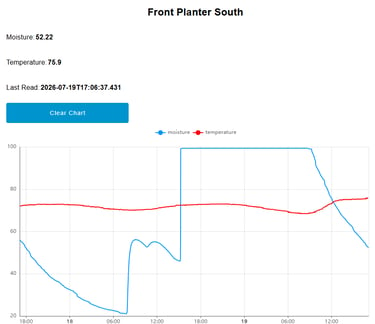
Data is Charted
Each sensor has a dashboard cluster to display a chart that includes moisture and temperature on the same scale. Digital indicators show key data above the chart. The name of the chart is automatically populated by the sensor ID.
(The dashboard version is Flowfuse Dashboard 2.0)
Data is Logged
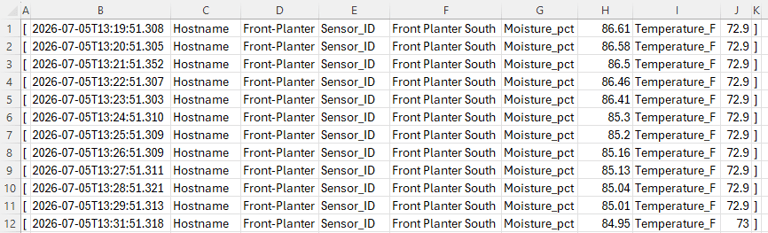
The data is logged to a file that has the same name of the sensors ID. Even if the sensor is moved to a different port on the Pi, it will still get appended to the correct log file.
The log file is comma separated and has a .csv file extension. This makes for a nice clean log that doesn't need text to column work to isolate the data values.
Why Node Red?
Getting Node Red set up takes a bit of learning, but it is a great tool to that is well worth the effort. These flows are simply a starting point that may be edited and expanded to meet your needs. There are lots of possibilities here from sending yourself a text message when moisture dips, to integration with smart home technologies. Not only that, it's actually a lot of fun too!
Check it out here

© Copyright 2025-2026 Trillium Technical Innovations LLC. All rights reserved. All registered or unregistered trademarks herein are the property of their respective owners.